
I've been hard at work these past few months on improving the 3D visualisation capabilities of geomorph, our R package for analysis of geometric morphometric data. Of note is the implementation of 3D Warping.
Version 2.0 of geomorph brings new developments in how shape deformations from 3D coordinate shape data can be viewed. I have implemented a set of neat functions for warping of 3D surface files (e.g., .ply files), which allows the user to visualise the shape deformations along Principal Component axes, Multivariate Regression slopes, Partial Least Squares axes and group differences, to name a few.
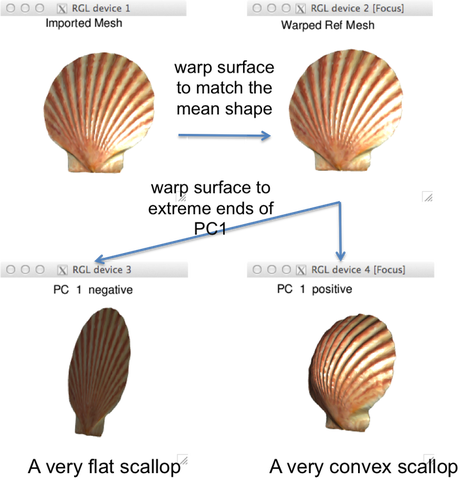
The new function warpRefMesh reads in a .ply file and landmark coordinates associated with this specimen, and uses the thin-plate spline method (Bookstein 1989) to warp the mesh into the shape defined by a second set of landmark coordinates, usually those of the mean shape for a set of aligned specimens. When using this function for warping, it is highly recommended that the mean shape (derived from the users sample using mshape) is used as the reference for warping (see Rohlf 1998).
See my blog on geomorph.net for the workflow. But most importantly, lets look at some eyecandy!
Version 2.0 of geomorph brings new developments in how shape deformations from 3D coordinate shape data can be viewed. I have implemented a set of neat functions for warping of 3D surface files (e.g., .ply files), which allows the user to visualise the shape deformations along Principal Component axes, Multivariate Regression slopes, Partial Least Squares axes and group differences, to name a few.
The new function warpRefMesh reads in a .ply file and landmark coordinates associated with this specimen, and uses the thin-plate spline method (Bookstein 1989) to warp the mesh into the shape defined by a second set of landmark coordinates, usually those of the mean shape for a set of aligned specimens. When using this function for warping, it is highly recommended that the mean shape (derived from the users sample using mshape) is used as the reference for warping (see Rohlf 1998).
See my blog on geomorph.net for the workflow. But most importantly, lets look at some eyecandy!
 RSS Feed
